![[Maple Plot]](parsurf/Parameterized_Surfaces_21.gif)
Parameterized Surfaces 2
> with(plots):
Warning, the name changecoords has been redefined
> with(linalg):
Warning, the protected names norm and trace have been redefined and unprotected
Paraboloid z = x^2 + 4*y^2
Parameterized as a graph
The picture only includes portions of the parameterized surface with z <=4.
>
plot3d([r,s,r^2+4*s^2],r=-2..2,s=
-1..1,view=[-2..2,-1..1,0..4],axes=framed,shading=zhue);
The top 2 X 2 portion of the derivative of this parameterization
has rank 2, so this parameterization (like all parameterizations of
surfaces z=f(x,y) as graphs (x,y) -> (x,y,f(x,y)) is always
nonsingular.
> jacobian([r,s,r^2+4*s^2],[r,s]);
![matrix([[1, 0], [0, 1], [2*r, 8*s]])](parsurf/Parameterized_Surfaces_22.gif)
Trigonometric Parameterization
A reparameterization of the paraboloid.
> subs(r=2*v*cos(u),s=v*sin(u),[r,s,r^2+4*s^2]);
![]()
> map(simplify,%);
>
>
![]()
The same paraboloid parameterized via trigonometric functions.
Notice how the grid lines in the pictures above and below are very different.
The curves r or s constant are parabolas;
The curves u=constant are parabolas, but v=constant gives an ellipse.
> plot3d([2*v*cos(u),v*sin(u),4*v^2],u=0.. 2 * Pi, v= 0..1,axes=framed,shading=zhue);
![[Maple Plot]](parsurf/Parameterized_Surfaces_25.gif)
Here the derivative has rank 1 when v=0, so the parameterization is
singular on any domain including points where v = 0.
> jacobian([2*v*cos(u),v*sin(u),4*v^2],[u,v]);
![matrix([[-2*v*sin(u), 2*cos(u)], [v*cos(u), sin(u)]...](parsurf/Parameterized_Surfaces_26.gif)
A Rational Parameterization.
The substitution u =2* arctan(t) (or t = tan(u/2) gives another interesting
parameterization.
> subs(u=2*arctan(t),[2*v*cos(u),v*sin(u),4*v^2]);
![]()
> param3 := map(simplify,map(expand,%));
>
![]()
If we let t range from -infinity to + infinity, u would range from -1 to 1.
This parameterization is not onto the entire paraboloid; we miss the curve
corresponding to u= .
> plot3d(param3,t=-10..10,v=0..1,axes=framed,shading=zhue,grid=[100,10]);
![[Maple Plot]](parsurf/Parameterized_Surfaces_29.gif)
Hyperboloid 9*x^2+4*y^2 -*z^2 = -36 of 2 sheets.
Hyperboloid 9*x^2+4*y^2 -*z^2 = -36 of 2 sheets.
This can be parameterized by a scaled hyperbolic version of spherical coordinates.
> hpb_fcn := 9*x^2+4*y^2-z^2;
![]()
A warmup on the algebra:
> simplify((sinh(u))^2-(cosh(u))^2);
![]()
> subs(x=2*sinh(u)*cos(v),y=3*sinh(u)*sin(v),9*x^2+4*y^2);
![]()
> simplify(%);
>
>
![]()
> subs(x=2*sinh(u)*cos(v),y=3*sinh(u)*sin(v),z=6*cosh(u),hpb_fcn);
![]()
> map(simplify,%);
>
>
![]()
This just gives one of the sheets.
Changing z to -6*cosh(u) would give the other.
> plot3d([2*sinh(u)*cos(v),3*sinh(u)*sin(v),6*cosh(u)],u=-2..2,v=0..2*Pi,axes=framed,shading=zhue,scaling=constrained);
![[Maple Plot]](parsurf/Parameterized_Surfaces_216.gif)
A hyperbolic cylinder 4*x^2 - z^2 -2*z = 0.
A hyperbolic cylinder 4*x^2 - z^2 -2*z = 0.
Completing the square in z causes us to rewrite this as
4*x^2 - (z+1)^2 = -1,
so letting 2*x be sinh(u) and z+1 be cosh(u) will work.
> subs(x=(1/2)*sinh(u), z= -1 + cosh(u),4*x^2 - (z+1)^2);
![]()
> simplify(%);
>
![]()
This is just one branch of the hyperbolic cylinder.
> plot3d([(1/2)*sinh(u),v,-1 + cosh(u)],u=-2..2,v=0..2,axes=framed,shading=zhue,scaling=constrained);
![[Maple Plot]](parsurf/Parameterized_Surfaces_219.gif)
The Whitney umbrella.
The Whitney umbrella.
> gr10 := plot3d([u*v,u,v^2],u=-10..10,v=-10..10,axes=boxed,orientation=[100,80],shading=xy,style=patch,labels=[x,y,z]):
>
display3d(gr10);
![[Maple Plot]](parsurf/Parameterized_Surfaces_220.gif)
Singular just at the origin.
> jacobian([u*v,u,v^2],[u,v]);
![matrix([[v, u], [1, 0], [0, 2*v]])](parsurf/Parameterized_Surfaces_221.gif)
An ellipsoid x^2 + 4*y^2 + 4*z^2 = 4.
An ellipsoid x^2 + 4*y^2 + 4*z^2 = 4.
>
gr1 := plot3d([2*sin(v)*cos(u),sin(v)*sin(u),cos(v)],u=0..2*Pi,v=0..Pi,grid=[16,16],
style=hidden,axes=framed,thickness=3):
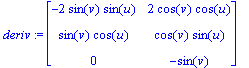
> deriv := jacobian([2*sin(v)*cos(u),sin(v)*sin(u),cos(v)],[u,v]);
Tangent to the v = constant curves.
> T_u := submatrix(deriv,1..3,1..1);
![T_u := matrix([[-2*sin(v)*sin(u)], [sin(v)*cos(u)],...](parsurf/Parameterized_Surfaces_223.gif)
Tangent ot the u = constant curves.
> T_v:= submatrix(deriv,1..3,2..2);
![T_v := matrix([[2*cos(v)*cos(u)], [cos(v)*sin(u)], ...](parsurf/Parameterized_Surfaces_224.gif)
A point on the ellipsoid. (u=0,v=3*Pi/10.)
> point_1 := evalf(subs(u=0,v=3*Pi/10,[2*sin(v)*cos(u),sin(v)*sin(u),cos(v)]));
![]()
This doesn't work because ,matrices are not evaluated in Maple without an explicit
request e.g. using "eval".
> T_u_1 := evalf(subs(u=0,v=3*Pi/10,T_u));
![]()
Evaluate the tangent vector T_u at point_1.
> T_u_1 := evalf(subs(u=0,v=3*Pi/10,eval(T_u)));
![T_u_1 := matrix([[-0.], [.8090169944], [0.]])](parsurf/Parameterized_Surfaces_227.gif)
Evaluate the tangent vector T_v at point_1.
> T_v_1 := evalf(subs(u=0,v=3*Pi/10,eval(T_v)));
![T_v_1 := matrix([[1.175570504], [0.], [-.8090169944...](parsurf/Parameterized_Surfaces_228.gif)
A line segment from point_1 pointing in the direction of T_u.
> gr1_u := spacecurve(evalm(point_1 + t*T_u_1),t=0.. .4,thickness=3,color=red):
A line segment from point_1 pointing in the direction of T_v.
> gr1_v := spacecurve(evalm(point_1 + t*T_v_1),t=0.. .25,thickness=3,color=red):
A coarse grid on the ellipsoid together with T_u and T_v at point1.
>
display3d([gr1,gr1_u,gr1_v],thickness=3);
![[Maple Plot]](parsurf/Parameterized_Surfaces_229.gif)
> normal_vec:= crossprod(convert(T_u,vector),convert(T_v,vector));
![]()
> map(simplify,normal_vec);
![]()
>