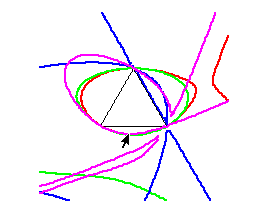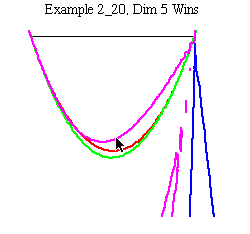

or a more closeup version:

These are pictures in the stress plane w1 + w2 +w3 = 1. Colors of curves correspond to different representations; Violet here is the 5 dimensional representation while green and red are 3 dimensional. Each curve represents the set of stress triples where a symmetric tensegrity using that stress and representation is in equilibrium. The sides of the black triangle correspond to stresses with at least one entry 0. The interior of the triangle corresponds to all stresses positive.
As one crosses the bottom edge of the triangle, the strut stress changes from positive to negative. (Choosing a fixed cable stress ratio confines one to a ray in this diagram.) In this case, paths moving downward from the bottom edge appear to generally cross the curve of the 5 dimensional representation first; i.e. it is the apparent winner here.
We say apparent here because this is just a Maple implicit plot based on a relatively coarse grid. Such pictures are suggestive, but not guarranteed to be correct. Techniques of symbolic algebraic computation can be used to rigorously establish features we see visually in such plots.
The example illustrated here is a remarkable one. It is the only A5 symmetric tensegrity (with equal cable stresses) where there is a clearly winning representation but its dimension is greater than 3.
Last Update: March 5, 1998