Gnuplot is an easy to use two and three dimensional graphing program. Some of its nice features include
The Gnuplot 3.5 binary is located on Superior in the directory /usr/local/bin. The distribution is in /local/gnuplot.
The Mac Version is in the Graphics subfolder of Mathlab Fileserver.
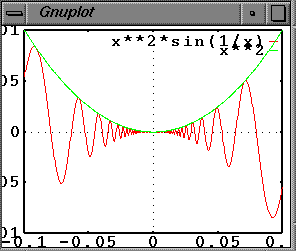
A simple example of plotting two functions of 1 variable is:
        set samples 500
        plot [x=-.1 : .1 ] [ -.01 : .01 ] x**2*sin(1/x),x**2
resulting in

To plot a datafile
       set parametric
       plot "data.dat" with linespoints
where "data.dat" might contain
0 1
1 10
2 45
3 120
4 210
5 252
6 210
7 120
8 45
9 10
10 1
giving

To generate postscript:
        set output "picture.ps"
        set term postscript
Surface plotting from a data file can be done by
       set parametric
       splot "data.dat"
where "data.dat" contains 3 column data.
The view can be adjusted by
set view 45
to rotate by 45 degrees about the x axis, as well as more complicated set
view commands.
It is also possible to plot both parametric and non-parametric
functions using splot.
Home Page
Last Update: June 20, 1996