2D Plotting
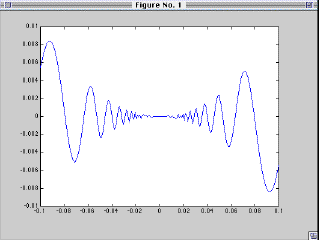
- Plotting y=f(x) on the interval [-.1,.1]:
- First create a vector of (e.g.) 200 equally spaces values between -.1 and .1.
- x1=linspace(-.1,.1,200);
- Suppose f(x) is an algebraic expression of standard functions such as f(x)= x^2*sin(1/x).
- Then the following computes the y values from the x values.
- y1 = x1 .^ 2 .* sin(1 ./ x1);
- Now put up the plot:
- plot(x1,y1)

- Adding Additional Graphs
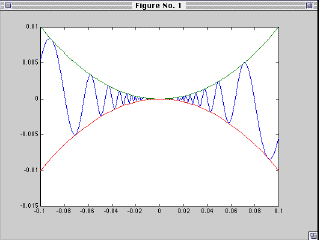
- can be accomplished by
- x2=linspace(-.1,.1,50);
- (Note that this function oscillates less, so we take a coarser grid with only 50 points.
- y2 = x2 .^2
- y3 = -x2 .^2
- plot(x1,y1,x2,y2,x2,y3)

Last Update: September 17, 1998
[Mathlab Home |
Math]