


Next: About this document
Up: No Title
Previous: No Title
Problem 1
Use Maple for this Problem! Look at the graphs of the function 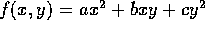 for -2<x <2, -2<y< 2 and
- a=1, b=0, c= 1,
- a=1, b=2, c= 1,
- a=1, b=4, c= 1,
- a=1, b=6, c= 1
- a=1, b=0 ,c= 4
- a=1, b=0, c = 6,
and at MORE values of your own choice.
Do you have any conjectures on how the graph depends on the parameters a,b,
and c? Try to cover some special cases: e.g. suppose a >0 and c >0;
what happens as b varies ?
Explain!
Problem 2
Find functions whose graphs fit the descriptions below. Use Maple to print
graphs verifying your solution. Include axes in the graphs.
- A bowl which opens upward and has its vertex at 5 on the z axis.
- A parabolic cylinder opening upward from along the line y=x in the
xy plane. (A parabolic cylinder is the shape formed by extruding a parabola
perpendicular to the plane in which it lies.)
- A cone with circular cross section having a vertex in the plane z=5
and passing through the origin.
Problem 3* (Extra Credit)
Explain why level curves of

for function values either
- a)
- small (e.g. c = .1), or
- b)
- large (e.g. c = 10)
in absolute value are generally predictable. Sketch what these should look like
qualitatively.
HINT: implicitplot( , color=red);